- Get link
- X
- Other Apps
- Get link
- X
- Other Apps
By Yahia El-Shall
The last post discussed the utility of databases. Here we will go through how to create a pivot table from a data table in order to extract, manipulate, and analyze the data to our needs.
Microsoft Excel's Pivot Table feature is an indispensable tool that allows us to extract, manipulate, and analyze data to our needs. Especially when dealing with large databases that have thousands of rows, pivot tables facilitate easy access to the data we need. Also, as data changes in the database, our pivot tables will update automatically. Thus, changing the way our data is summarized becomes much simpler. We will be making a simple pivot table to summarize sales data from our previous simple database.
Objectives
By the time you finish reading this you will be able to:
- Create your data table in the proper format
- Product a pivot table from that data table
- Manipulate the pivot table report to summarize your data as it suits your needs
Our data table includes order data for sales reps broken down by items sold, units of items sold, cost, and total.
| OrderDate | Region | Rep | Item | Units | Unit Cost | Total |
| 1/6/14 | East | Jones | Pencil | 95 | 1.99 | 189.05 |
| 1/23/14 | Central | Kivell | Binder | 50 | 19.99 | 999.50 |
| 2/9/14 | Central | Jardine | Pencil | 36 | 4.99 | 179.64 |
| 2/26/14 | Central | Gill | Pen | 27 | 19.99 | 539.73 |
| 3/15/14 | West | Sorvino | Pencil | 56 | 2.99 | 167.44 |
| 4/1/14 | East | Jones | Binder | 60 | 4.99 | 299.40 |
| 4/18/14 | Central | Andrews | Pencil | 75 | 1.99 | 149.25 |
| 5/5/14 | Central | Jardine | Pencil | 90 | 4.99 | 449.10 |
| 5/22/14 | West | Thompson | Pencil | 32 | 1.99 | 63.68 |
| 6/8/14 | East | Jones | Binder | 60 | 8.99 | 539.40 |
| 6/25/14 | Central | Morgan | Pencil | 90 | 4.99 | 449.10 |
| 7/12/14 | East | Howard | Binder | 29 | 1.99 | 57.71 |
| 7/29/14 | East | Parent | Binder | 81 | 19.99 | 1,619.19 |
| 8/15/14 | East | Jones | Pencil | 35 | 4.99 | 174.65 |
| 9/1/14 | Central | Smith | Desk | 2 | 125.00 | 250.00 |
| 9/18/14 | East | Jones | Pen Set | 16 | 15.99 | 255.84 |
| 10/5/14 | Central | Morgan | Binder | 28 | 8.99 | 251.72 |
| 10/22/14 | East | Jones | Pen | 64 | 8.99 | 575.36 |
| 11/8/14 | East | Parent | Pen | 15 | 19.99 | 299.85 |
| 11/25/14 | Central | Kivell | Pen Set | 96 | 4.99 | 479.04 |
| 12/12/14 | Central | Smith | Pencil | 67 | 1.29 | 86.43 |
| 12/29/14 | East | Parent | Pen Set | 74 | 15.99 | 1,183.26 |
| 1/15/15 | Central | Gill | Binder | 46 | 8.99 | 413.54 |
| 2/1/15 | Central | Smith | Binder | 87 | 15.00 | 1,305.00 |
| 2/18/15 | East | Jones | Binder | 4 | 4.99 | 19.96 |
| 3/7/15 | West | Sorvino | Binder | 7 | 19.99 | 139.93 |
| 3/24/15 | Central | Jardine | Pen Set | 50 | 4.99 | 249.50 |
| 4/10/15 | Central | Andrews | Pencil | 66 | 1.99 | 131.34 |
| 4/27/15 | East | Howard | Pen | 96 | 4.99 | 479.04 |
| 5/14/15 | Central | Gill | Pencil | 53 | 1.29 | 68.37 |
| 5/31/15 | Central | Gill | Binder | 80 | 8.99 | 719.20 |
| 6/17/15 | Central | Kivell | Desk | 5 | 125.00 | 625.00 |
| 7/4/15 | East | Jones | Pen Set | 62 | 4.99 | 309.38 |
| 7/21/15 | Central | Morgan | Pen Set | 55 | 12.49 | 686.95 |
| 8/7/15 | Central | Kivell | Pen Set | 42 | 23.95 | 1,005.90 |
| 8/24/15 | West | Sorvino | Desk | 3 | 275.00 | 825.00 |
| 9/10/15 | Central | Gill | Pencil | 7 | 1.29 | 9.03 |
| 9/27/15 | West | Sorvino | Pen | 76 | 1.99 | 151.24 |
| 10/14/15 | West | Thompson | Binder | 57 | 19.99 | 1,139.43 |
| 10/31/15 | Central | Andrews | Pencil | 14 | 1.29 | 18.06 |
| 11/17/15 | Central | Jardine | Binder | 11 | 4.99 | 54.89 |
| 12/4/15 | Central | Jardine | Binder | 94 | 19.99 | 1,879.06 |
| 12/21/15 | Central | Andrews | Binder | 28 | 4.99 | 139.72 |
If this data table was comprised of thousands of rows, using formulas would not be an efficient way to summarize extracted data. Pivot tables can provide different combinations of data much more simply.
How to organize your data
First, your data table must have column headings. Column headings should accurately describe the data listed in the column. When we create our pivot tables, these column headings will assist us in organizing our extracted data.
Next, your data table cannot have empty rows or columns. If formatted as a data table and not just a range, make sure your table does not have empty cells.
Ensure that your data corresponds with the appropriate column heading and row.
Insert a blank Pivot Table
1. Select an empty cell to insert your pivot table.
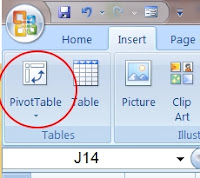
2. Click on the Insert menu and click the PivotTable button.
3. The following dialog box will appear:
4. Select your data table either by clicking and scrolling over the data table with your mouse, or if you have named your table, input the name of the table. You can choose where to insert the pivot table.
5. Once finished, click OK. A blank pivot table will have been inserted.
Modifying the layout of your Pivot Table
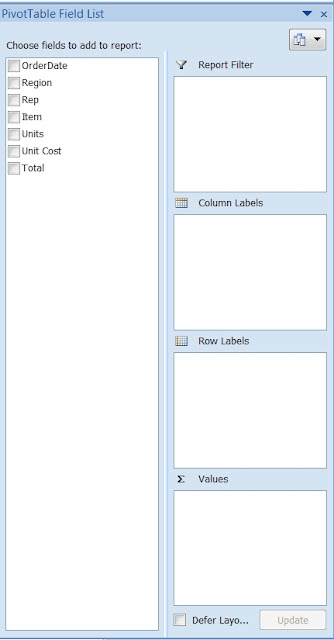
Below is what your blank pivot table should look like. How do we populate it with data? To build a report, choose fields from the pivot table field list.
The field list should show the column headings from your data table.
1.Select the fields you want included in your table.
2. Place the fields in the correct location for the layout you want. (report filter, column labels, row labels, or values.
3. In this report, we have selected Rep for the Row labels, Item for the column labels, and total revenue for the values.
4. The pivot table generated from these selections looks like this:
Now we see the total revenues / item for each of our sales reps. This is just one example of how we can summarize our data. Again, it depends on how you want to summarize and eventually analyze your data. You can change the layout of your pivot table from tabular under the Design tab.
In the next post, we'll take a look at how to build on your use of pivot tables with pivot charts.


Comments
Post a Comment